Why Does My DNA Test Show South Asian Ancestry When My Family Is Arab From the Gulf
A small South Asian share in an Arab or Gulf DNA result is common. It usually reflects Indian Ocean contact plus how the panel draws its regional borders, not a mistake.
A small South Asian share, often a few percent and sometimes more, is a common result for Arabs from the Gulf and Oman, and for Iranians. Yemeni results tend to show more African and less South Asian ancestry. For the Gulf, it usually comes from two things at once: real, well-documented contact across the Indian Ocean, and the way a reference panel decides which region a shared genetic signal belongs to. Whether yours is real depends on the ± range, on which reference populations sit closest to you, and on whether a second panel agrees.
Two causes stack: an old sea and a reference panel
The first is history. Gulf and Omani ports were tied to Gujarat, Sindh, Makran and the Malabar coast by monsoon trade for a very long time. Ships came with the winter winds and left with the summer ones, and people stayed. People and goods moved in both directions. Genetic studies of Gulf populations report African and South Asian or Iranian components, but the mix varies by community. Some groups, such as Persian-descended and coastal communities in Qatar, Bahrain and the UAE, carry more South Asian or Iranian ancestry than African, while others carry more African. Dating of both the African and the South Asian components is uncertain, and published estimates differ.
Many Gulf readers will recognise these links from their own surroundings: Baloch families in Oman and the UAE, Ajam (Persian-descended) families, and long-standing Gujarati and Sindhi merchant families in Muscat and Bahrain. Shares near or above 10% often trace to these links.
The second is the panel, together with deep shared ancestry. An ancestry test does not look for "South Asian DNA". It fits your genome as a mixture of reference populations and reports the best-fitting proportions. Iran-related and South Asian ancestry share deep roots. If the panel has few Gulf or Iranian references, or lumps them into one big West Asian bucket, a signal that Gulf people share with both Iranians and South Asians has to be assigned somewhere, and some of it lands in the South Asian column.
What a real signal looks like next to noise
The ± range is the first filter. A share of 2% with a range of ±2 is statistically close to zero, and you should read it as "probably nothing". A share of 8% with a range of ±2 is not zero. These figures are only to show the logic, but the logic holds on any report that prints a range.
The closest reference populations are the second filter. Look at who your genome sits nearest to. If the top matches are all Arabian and Iranian groups, and no South Asian group appears near the top, the South Asian share is a small tail on an otherwise Arabian profile. If a South Asian group ranks surprisingly high, that is a stronger hint of real recent contact. Use any test that ranks closest populations for this check.
| Share and range | Closest populations | Second panel | |
|---|---|---|---|
| Likely noise | 2% ±2, touches zero | All Arabian or Iranian | Share disappears |
| Unclear | 5% ±3 | Mostly Arabian, one South Asian group lower down | Share shrinks |
| Likely real | 8% ±2, clear of zero | A South Asian group ranks near the top | Share persists |
Scroll the table sideways for the rest →
A rule of thumb, not a verdict. All percentages are illustrative.
Check it three ways
- Read the range, not the headline number. If the range reaches zero, treat the share as unproven.
- Read the ranked closest populations. A South Asian share with no South Asian group near the top is weaker evidence.
- Run the same data through a second panel or a service that accepts raw-file uploads (MyHeritage, FamilyTreeDNA, or a free tool). 23andMe and AncestryDNA do not accept uploads, so download your raw file from them first. A share that survives a change of panel is more likely real. One that vanishes or jumps to "Iranian" or "Middle Eastern" was probably a boundary effect.
Does it mean a recent ancestor?
Not necessarily, and this is where people overread. A single ancestor five generations back contributes on average 1/32 of your DNA, about 3%. At seven generations it is about 0.8%. The chance of inheriting nothing from a given ancestor is tiny at five generations, grows at six to seven, and becomes common beyond eight to ten. A small inherited share may also fall below what a test can resolve, or be assigned to a neighbouring region.
So a 4% South Asian result could be one great-great-great-grandparent, or several older and more distant contributions, or an artifact. The test cannot tell these apart. A real ancestor can be missed or relabelled, and a few percent can appear with no such ancestor in the family story, because of panel effects and shared deep ancestry.
It says nothing about your tribe or your nasab
Autosomal ancestry is a statistical blend of your whole genome compared with modern reference groups. It does not read a lineage, a tribe or a nasab, and it cannot confirm or deny one. A written family tree and an autosomal result answer different questions.
If you want the lines, the Y haplogroup (father's line) and mtDNA haplogroup (mother's line) follow single paths and are a separate kind of evidence. You can explore both on the HealthOSX haplogroup page, which reads the haplogroups on your own device. They are also limited: they describe one ancestor out of many.
A small South Asian share in a Gulf Arab result is a statement about a reference panel and an old sea, not about who your family is.
Where the simple answer fails
If the share is large, say well above 10% with a tight range, and your closest populations are South Asian, a more recent family connection, such as the Baloch, Sindhi or Gujarati links above, may matter more than old Indian Ocean contact. That is worth checking against your family's own history.
Very small shares from a single consumer test deserve the least trust. And no panel is neutral. Every one is built from the people someone chose to sample, so the answer always depends partly on who was left out.
See it in your own numbers
If you have a raw file from 23andMe, AncestryDNA or MyHeritage, the free HealthOSX DNA tool shows the breakdown with a ± on every share and ranks your closest reference populations. It also draws a PCA plot, so you can see whether your dot sits among the reference populations, between the Arabian and South Asian clusters or not. Its panel is built to separate Arabia, the Levant, Anatolia/Iran, the Caucasus and North Africa as separate regions, which is the resolution this question needs.
Choosing a file. The report is read on your own device.
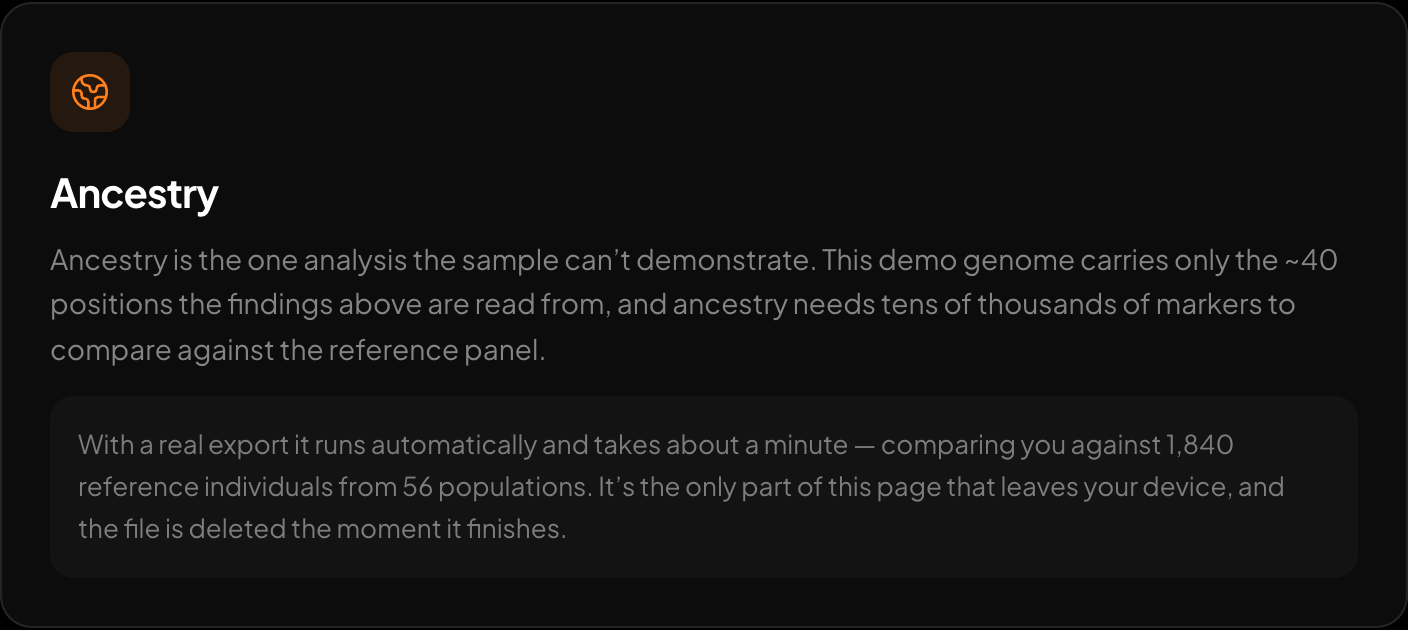
Ancestry across 15 regions and 157 reference populations.
Ancestry runs on the server only with your explicit consent, and only the markers it needs are sent. You can remove everything at any time with "Delete my DNA data". The tool is also available in Arabic at healthosx.com/ar/dna.
New to raw DNA files? Start with the full guide: 23andMe Raw Data Interpretation Free in Your Browser
Written by
HealthOSX Research